Файл:Population Pyramid Germany 2021 (CIA World Factbook).png

Исходный файл (1000 × 583 пкс, размер файла: 88 Кб, MIME-тип: image/png)
Описание
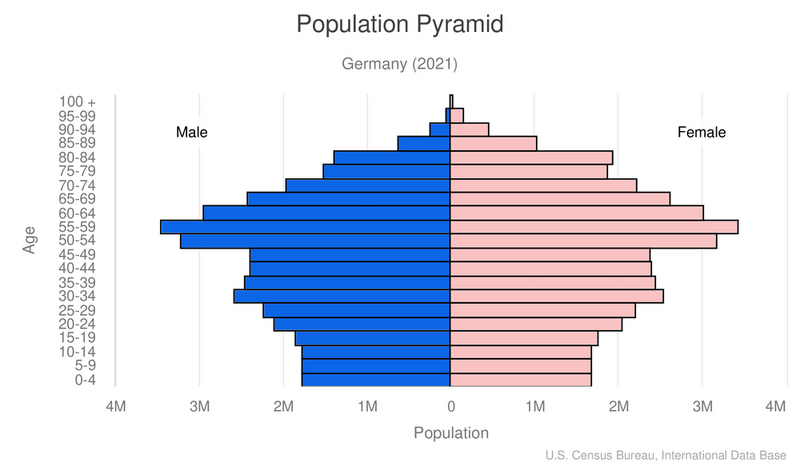
| Описание | The population pyramid of Germany illustrates the age and sex structure of the german population. The population is distributed along the horizontal axis, with males shown on the left and females on the right. The male and female populations are broken down into 5-year age groups represented as horizontal bars along the vertical axis, with the youngest age groups at the bottom and the oldest at the top. The shape of the population pyramid gradually evolves over time based on fertility, mortality, and international migration trends. |
|---|---|
| Источник | CIA World Factbook |
| Время создания | retrieved 16/03/2021 |
| Автор или правообладатель | Central Intelligence Agency (CIA) — Лицензия: Public domain (в общественном достоянии) |
| Другие версии файла | — |
Источник файла — сайт Wikimedia Commons, куда он был загружен под одной из свободных лицензий ( https://commons.wikimedia.org/wiki/File:Population_Pyramid_Germany_2021_(CIA_World_Factbook).png ). Авторов, работавших над этим файлом см. в истории файла: https://commons.wikimedia.org/w/index.php?title=File:Population_Pyramid_Germany_2021_(CIA_World_Factbook).png&action=history
.png)
.png&action=history)
В общем случае в статьях энциклопедии Руниверсалис файлы используются в соответствии со статьёй 1274 Гражданского кодекса Российской Федерации.
История файла
Нажмите на дату/время, чтобы увидеть версию файла от того времени.
| Дата/время | Миниатюра | Размеры | Участник | Примечание | |
|---|---|---|---|---|---|
| текущий | 20:16, 31 августа 2023 | | 1000 × 583 (88 Кб) | Я, робот (обсуждение | вклад) | == Описание == {{Изображение | описание = The population pyramid of Germany illustrates the age and sex structure of the german population. The population is distributed along the horizontal axis, with males shown on the left and females on the right. The male and female populations are broken down into 5-year age groups represented as horizontal bars along the vertical axis, with the youngest age groups at the bottom and the oldest at the top. The shape of the population pyramid gradually e... |
Вы не можете перезаписать этот файл.
Использование файла
Следующий файл является дубликатом этого файла (подробности):
.png)
- Файл:Population Pyramid Germany 2021 (CIA World Factbook).png из на Викискладе
Следующие 2 страницы используют этот файл:
.png&oldid=16797447)