Файл:Active COVID-19 cases in Montenegro.png
Active_COVID-19_cases_in_Montenegro.png (529 × 587 пкс, размер файла: 55 КБ, MIME-тип: image/png)
Описание
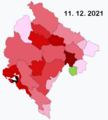
| Описание | This map shows active COVID-19 cases per 100,000 inhabitants by municipality. If the map gets darker, it doesn't actually mean the situation is worsening, but it means there are smaller differences in active cases between municipalities with biggest and lowest number. If the map gets lighter, it means there is a big difference between municipality with highest number of active cases and other municipalities; this often happens if a hotspot appears in some of the municipalities (there is always one municipality black). If a municipality is green, it means there are currently no active cases. Because of small population in most of the municipalities, this map looks different with every daily update and the colours can change very quickly. Data used to create the map come from official Montenegrin COVID-19 statistics page – https://www.covidodgovor.me/me/statistika |
|---|---|
| Источник | Own work |
| Время создания | 2021-03-01 |
| Автор или правообладатель | Moson81 — Лицензия: CC BY-SA 4.0 (Creative Commons Attribution-Share Alike 4.0) https://creativecommons.org/licenses/by-sa/4.0 |
| Другие версии файла | — |
Источник файла — сайт Wikimedia Commons, куда он был загружен под одной из свободных лицензий ( https://commons.wikimedia.org/wiki/File:Active_COVID-19_cases_in_Montenegro.png ). Авторов, работавших над этим файлом см. в истории файла: https://commons.wikimedia.org/w/index.php?title=File:Active_COVID-19_cases_in_Montenegro.png&action=history
В общем случае в статьях энциклопедии Руниверсалис файлы используются в соответствии со статьёй 1274 Гражданского кодекса Российской Федерации.
История файла
Нажмите на дату/время, чтобы увидеть версию файла от того времени.
| Дата/время | Миниатюра | Размеры | Участник | Примечание | |
|---|---|---|---|---|---|
| текущий | 16:03, 6 сентября 2023 |  | 529 × 587 (55 КБ) | I, Robot (обсуждение | вклад) | == Описание == {{Изображение | описание = This map shows active COVID-19 cases per 100,000 inhabitants by municipality. If the map gets darker, it doesn't actually mean the situation is worsening, but it means there are smaller differences in active cases between municipalities with biggest and lowest number. If the map gets lighter, it means there is a big difference between municipality with highest number of active cases and other municipalities; this often happens if a hotspot appears in... |
Вы не можете перезаписать этот файл.
Использование файла
Следующий файл является дубликатом этого файла (подробности):
- Файл:Active COVID-19 cases in Montenegro.png из на Викискладе
Следующая страница использует этот файл:
