
Файл:2009 Atlantic hurricane season summary map.png
Размер этого предпросмотра: 800 × 495 пкс. Другое разрешение: 1600 × 990 пкс.
Исходный файл (1600 × 990 пкс, размер файла: 1,04 МБ, MIME-тип: image/png)
Описание
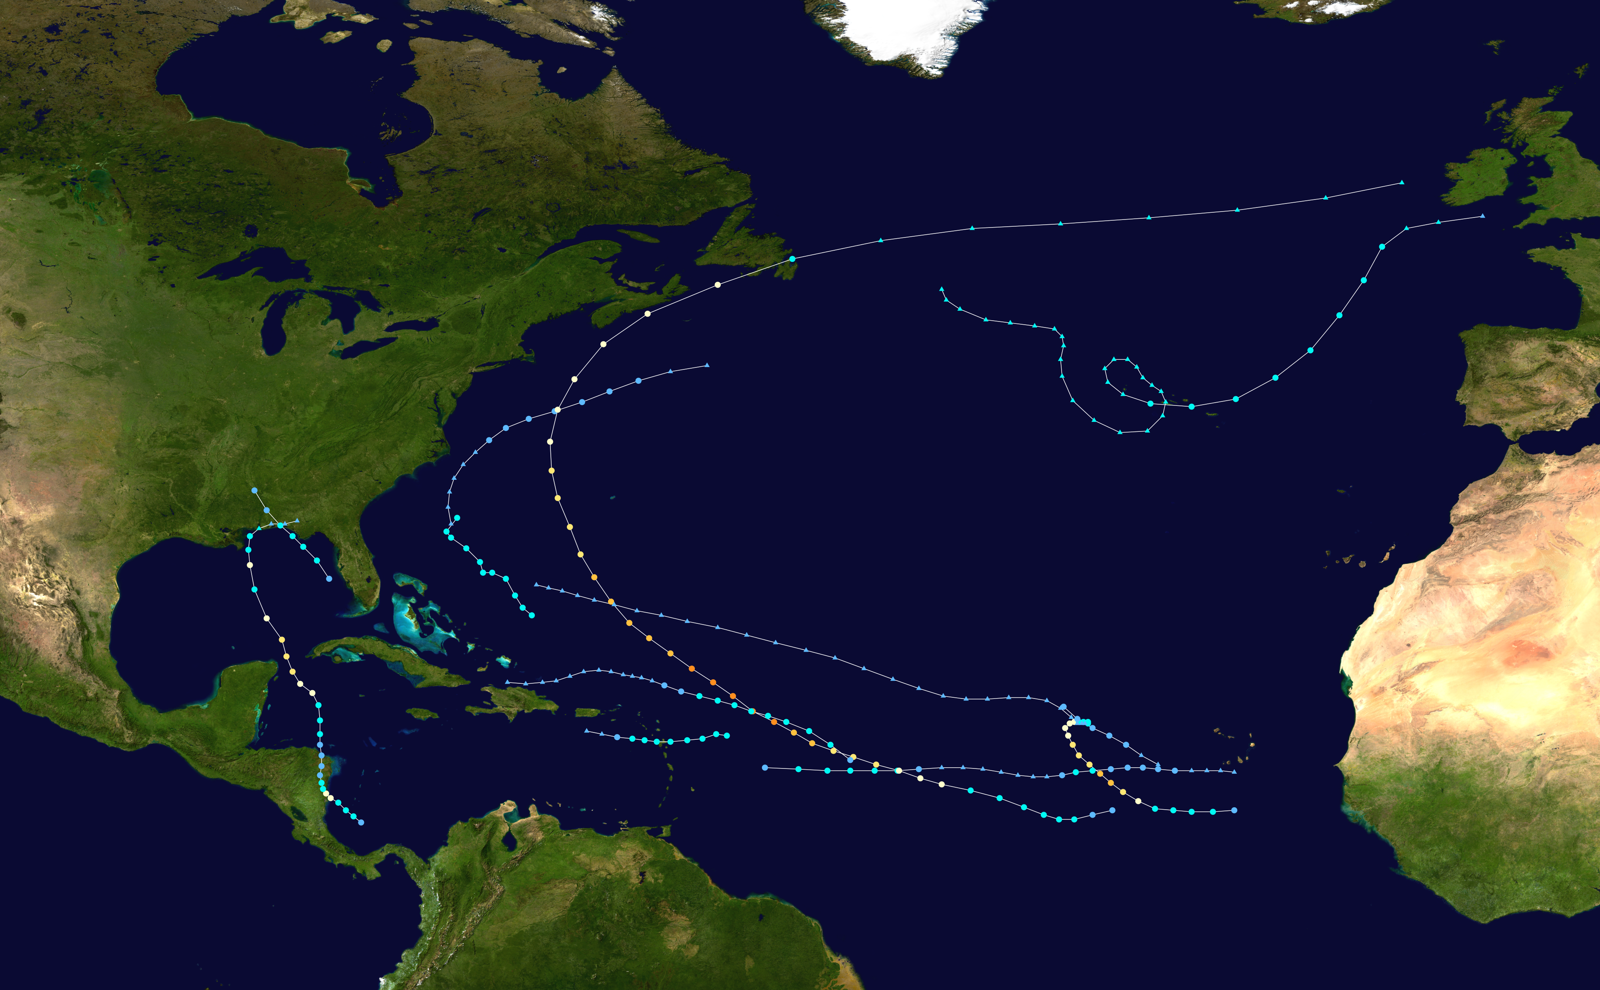
| Описание | This map shows the tracks of all tropical cyclones in the 2009 Atlantic hurricane season. The points show the location of each storm at 6-hour intervals. The colour represents the storm's maximum sustained wind speeds as classified in the Saffir-Simpson Hurricane Scale (see below), and the shape of the data points represent the type of the storm. |
|---|---|
| Источник | Created using Wikipedia:WikiProject Tropical cyclones/Tracks. The background image is from NASA [1]. The tracking data is from the National Hurricane Center's Atlantic hurricane database |
| Время создания | Отсутствует информация о времени создания! |
| Автор или правообладатель | Juliancolton — Лицензия: Public domain (в общественном достоянии) |
| Другие версии файла | — |
Источник файла — сайт Wikimedia Commons, куда он был загружен под одной из свободных лицензий ( https://commons.wikimedia.org/wiki/File:2009_Atlantic_hurricane_season_summary_map.png ). Авторов, работавших над этим файлом см. в истории файла: https://commons.wikimedia.org/w/index.php?title=File:2009_Atlantic_hurricane_season_summary_map.png&action=history
В общем случае в статьях энциклопедии Руниверсалис файлы используются в соответствии со статьёй 1274 Гражданского кодекса Российской Федерации.
История файла
Нажмите на дату/время, чтобы увидеть версию файла от того времени.
| Дата/время | Миниатюра | Размеры | Участник | Примечание | |
|---|---|---|---|---|---|
| текущий | 01:30, 7 сентября 2023 | | 1600 × 990 (1,04 МБ) | Я, робот (обсуждение | вклад) | == Описание == {{Изображение | описание = This map shows the tracks of all [https://en.wikipedia.org/wiki/Tropical_cyclone tropical cyclones] in the [https://en.wikipedia.org/wiki/2009_Atlantic_hurricane_season 2009 Atlantic hurricane season]. The points show the location of each storm at 6-hour intervals. The colour represents the storm's [https://en.wikipedia.org/wiki/maximum_sustained_wind maximum sustained wind speeds] as classified in the Saffir-Simpson Hurricane Scale (see below), and... |
Вы не можете перезаписать этот файл.
Использование файла
Следующие 2 страницы используют этот файл: