

Файл:South Africa 2011 dominant population group map.svg


Исходный файл (SVG-файл, номинально 809 × 709 пкс, размер файла: 787 КБ)
Описание
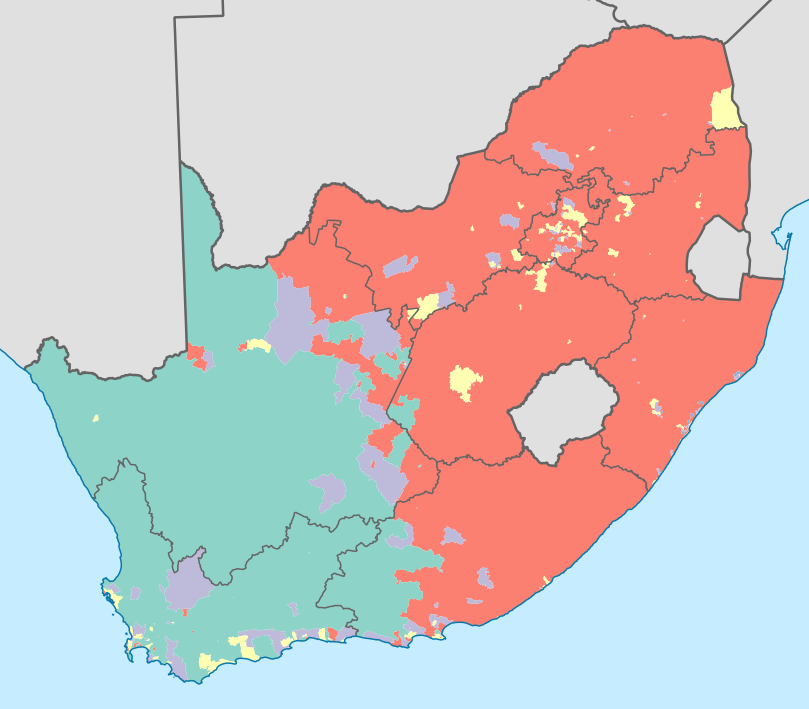
| Описание | Map showing the dominant population groups in South Africa, according to Census 2011, at electoral ward level. A population group is considered dominant if it makes up more than 50% of the population in a ward, or if it makes up more than 33% and no other group makes up more than 25%.
Black African
Coloured
Indian or Asian
White
No group dominant
Projection is Albers Equal-Area Conic, with standard parallels at 25.5° S and 31.5° S, and origin at 28.5° S 25.5° E. |
|---|---|
| Источник | Statistics South Africa's Census 2011 is the source of the basic population data. The map results from my own processing of the data. The map results from my own processing of the data. For ward boundaries see File:South Africa electoral wards 2011 blank.svg. |
| Время создания | 2013-04-16 |
| Автор или правообладатель | Htonl — Лицензия: Public domain (в общественном достоянии) |
| Другие версии файла | — |

Источник файла — сайт Wikimedia Commons, куда он был загружен под одной из свободных лицензий ( https://commons.wikimedia.org/wiki/File:South_Africa_2011_dominant_population_group_map.svg ). Авторов, работавших над этим файлом см. в истории файла: https://commons.wikimedia.org/w/index.php?title=File:South_Africa_2011_dominant_population_group_map.svg&action=history


В общем случае в статьях энциклопедии Руниверсалис файлы используются в соответствии со статьёй 1274 Гражданского кодекса Российской Федерации.
История файла
Нажмите на дату/время, чтобы увидеть версию файла от того времени.
| Дата/время | Миниатюра | Размеры | Участник | Примечание | |
|---|---|---|---|---|---|
| текущий | 10:10, 11 января 2024 | | 809 × 709 (787 КБ) | Я, робот (обсуждение | вклад) | == Описание == {{Изображение | описание = Map showing the dominant population groups in South Africa, according to Census 2011, at electoral ward level. A population group is considered dominant if it makes up more than 50% of the population in a ward, or if it makes up more than 33% and no other group makes up more than 25%. <div class="legend" style="direction:ltr;line-height:23px;"><div class="legend-content" style="display:inline-block;vertical-align:top;box-sizing:border-box;width:34px;... |
Вы не можете перезаписать этот файл.
Использование файла
Следующий файл является дубликатом этого файла (подробности):

- Файл:South Africa 2011 dominant population group map.svg на общем хранилище
Следующие 3 страницы используют этот файл:

