

Файл:South Africa 2011 dominant language map.svg


Исходный файл (SVG-файл, номинально 809 × 709 пкс, размер файла: 798 КБ)
Описание
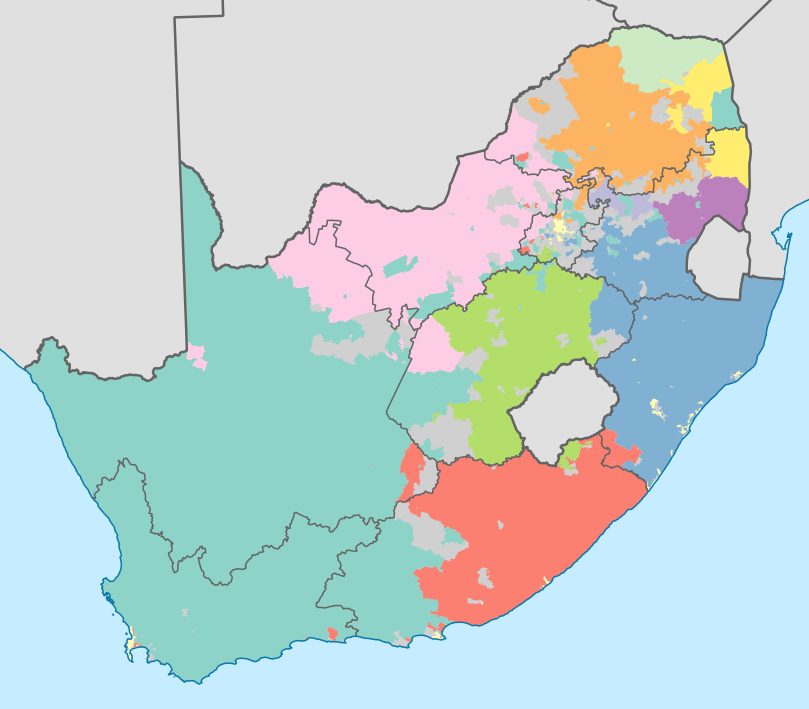
| Описание | Map showing the dominant home languages in South Africa, based on ward-level data from the 2011 census. In this context, a language is dominant if it more than 50% of the population in a ward speak it at home, or more than 33% speak it and no other language is spoken by more than 25%.
English
Afrikaans
isiNdebele
isiXhosa
isiZulu
Sesotho sa Leboa
Sesotho
Setswana
siSwati
Tshivenda
Xitsonga
No language dominant
Projection is Albers Equal-Area Conic, with standard parallels at 25.5° S and 31.5° S, and origin at 28.5° S 24.5° E. |
|---|---|
| Источник | Statistics South Africa's Census 2011 is the source of the basic population data. The map results from my own processing of the data. For ward boundaries see File:South Africa electoral wards 2011 blank.svg. |
| Время создания | 2012-11-18 |
| Автор или правообладатель | Htonl — Лицензия: Public domain (в общественном достоянии) |
| Другие версии файла | — |

Источник файла — сайт Wikimedia Commons, куда он был загружен под одной из свободных лицензий ( https://commons.wikimedia.org/wiki/File:South_Africa_2011_dominant_language_map.svg ). Авторов, работавших над этим файлом см. в истории файла: https://commons.wikimedia.org/w/index.php?title=File:South_Africa_2011_dominant_language_map.svg&action=history


В общем случае в статьях энциклопедии Руниверсалис файлы используются в соответствии со статьёй 1274 Гражданского кодекса Российской Федерации.
История файла
Нажмите на дату/время, чтобы увидеть версию файла от того времени.
| Дата/время | Миниатюра | Размеры | Участник | Примечание | |
|---|---|---|---|---|---|
| текущий | 10:09, 11 января 2024 | | 809 × 709 (798 КБ) | Я, робот (обсуждение | вклад) | == Описание == {{Изображение | описание = Map showing the dominant home languages in South Africa, based on ward-level data from the 2011 census. In this context, a language is dominant if it more than 50% of the population in a ward speak it at home, or more than 33% speak it and no other language is spoken by more than 25%. <div class="legend" style="direction:ltr;line-height:23px;"><div class="legend-content" style="display:inline-block;vertical-align:top;box-sizing:border-box;width:34px;... |
Вы не можете перезаписать этот файл.
Использование файла
Следующий файл является дубликатом этого файла (подробности):

- Файл:South Africa 2011 dominant language map.svg на общем хранилище
Следующие 3 страницы используют этот файл:

