


Файл:ReplicationTimingAnim.gif
Исходный файл (960 × 411 пкс, размер файла: 187 КБ, MIME-тип: image/gif, закольцованный, 11 фреймов, 5,5 с)
Описание
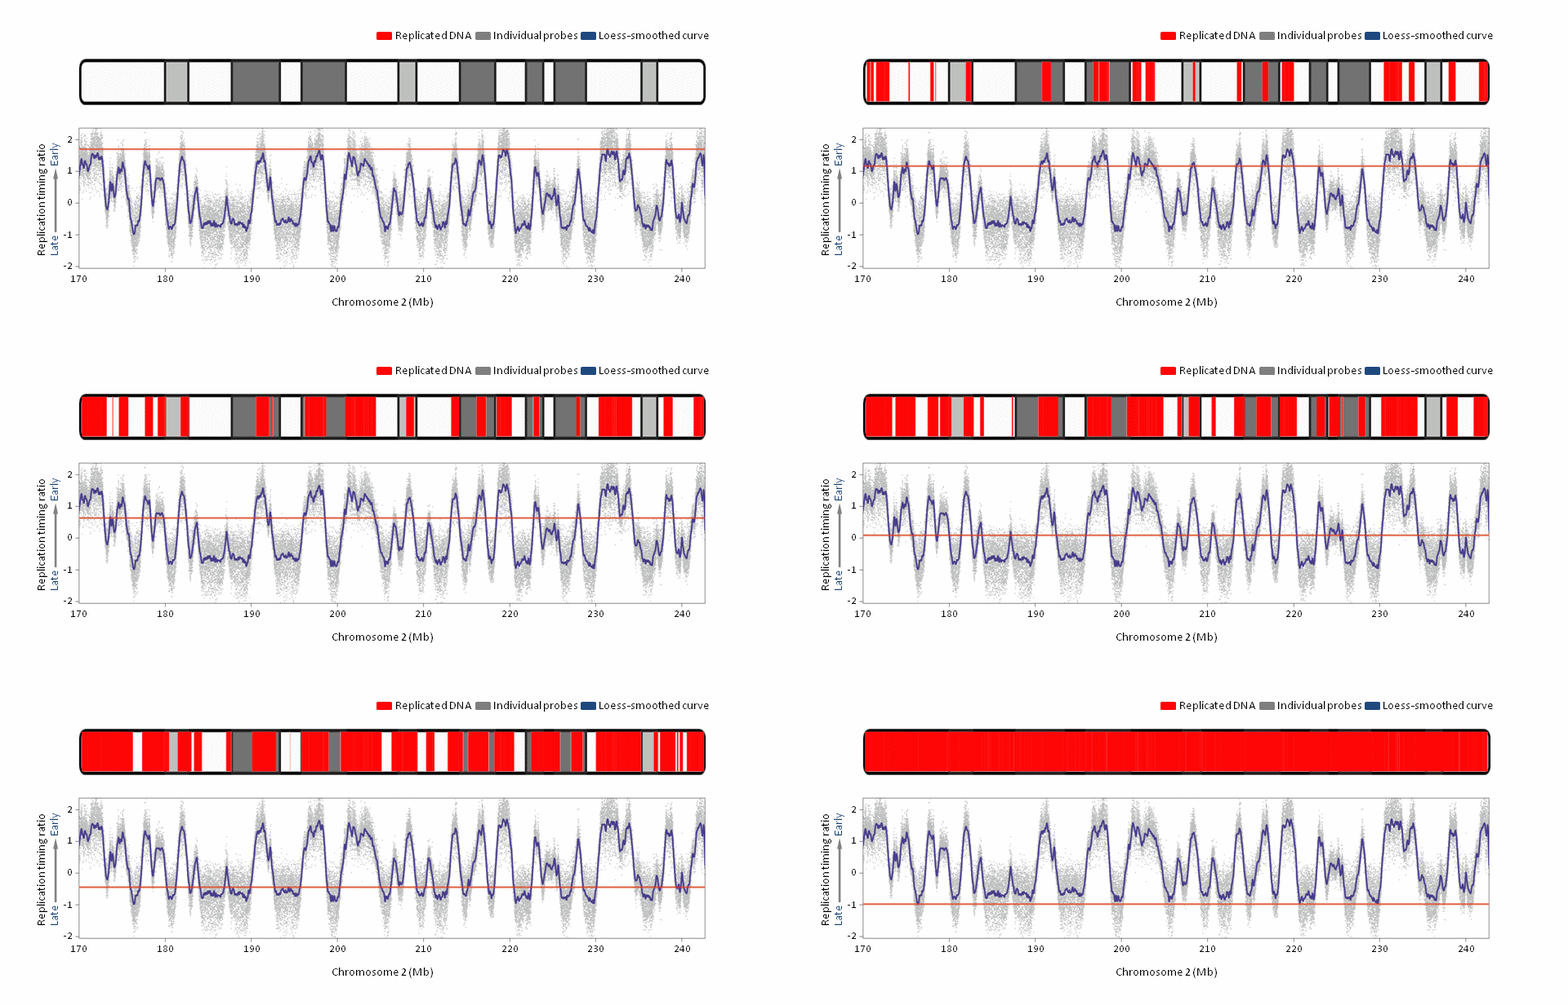
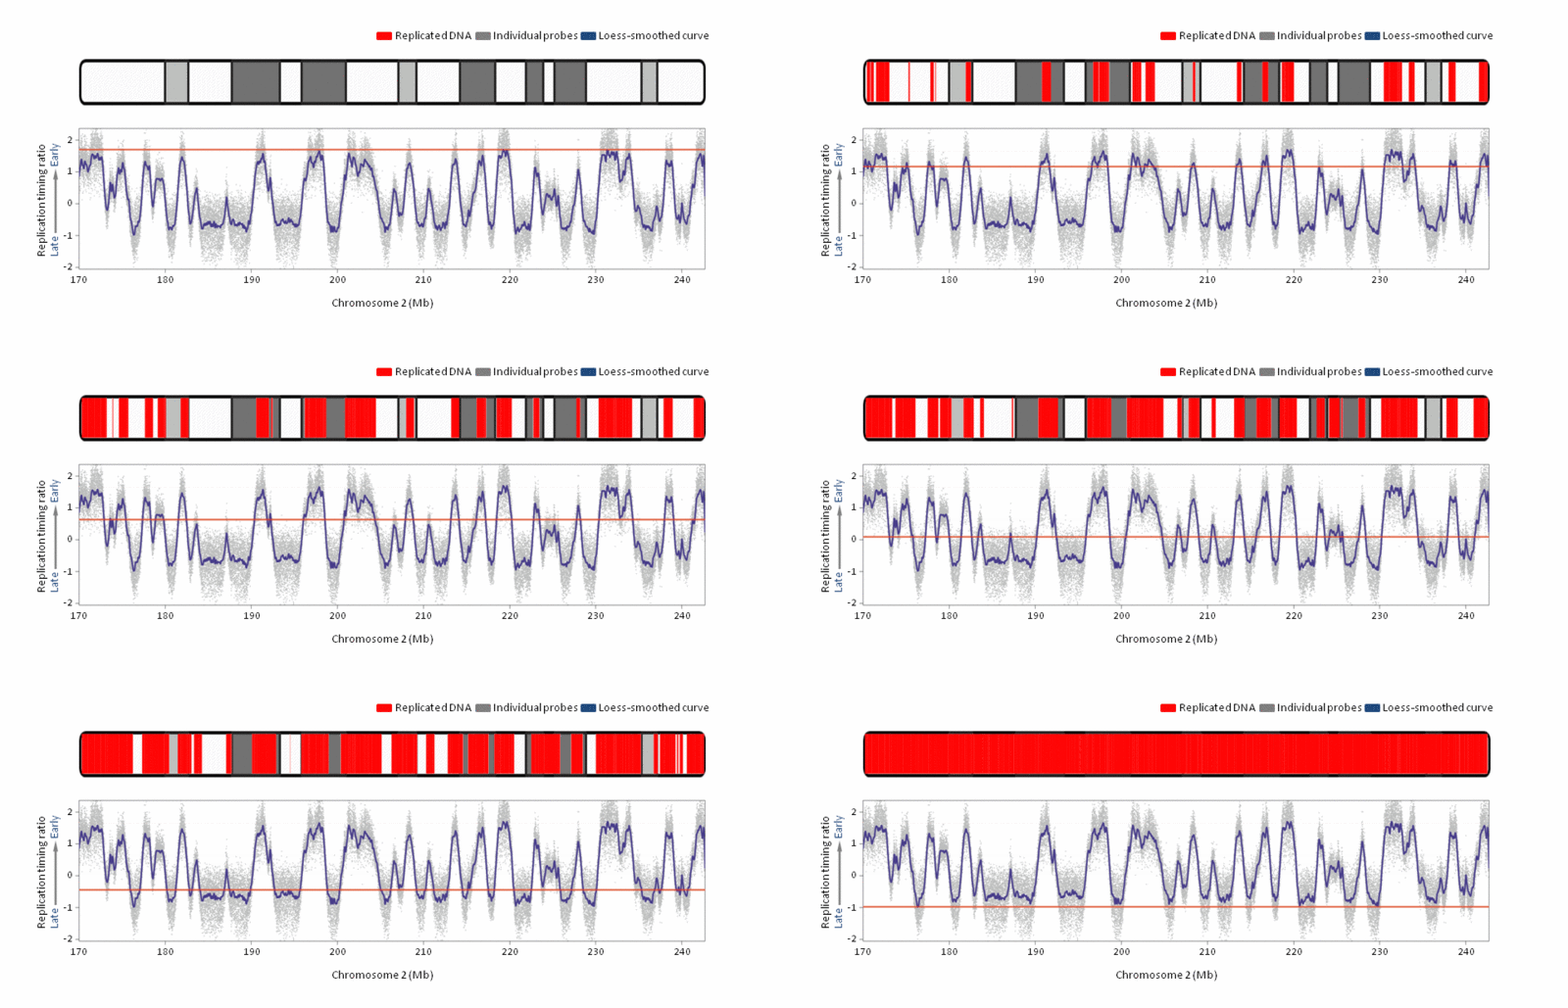
| Описание | A diagrammatic representation of replication timing in a 70-Mb segment of human chromosome 2. The red horizontal line represents time in S-phase, from early (top) to late (bottom). Grey data points each represent a different DNA sequence position along the length of chromosome 2 as indicated on the x axis, with more positive values on the y-axis indicating earlier replication. A smoothed line (blue) is drawn through the data to visualize the domains of different replication timing. Red bands at the top of the image show DNA that has been replicated at the given time in S-phase.
This file was transfered to Commons from en-wiki |
|---|---|
| Источник | wiki-en |
| Время создания | 2013-05-04 03:47:05 |
| Автор или правообладатель | en:Replicationdomain — Лицензия: CC BY 3.0 (Creative Commons Attribution 3.0) https://creativecommons.org/licenses/by/3.0 |
| Другие версии файла | — |
Источник файла — сайт Wikimedia Commons, куда он был загружен под одной из свободных лицензий ( https://commons.wikimedia.org/wiki/File:ReplicationTimingAnim.gif ). Авторов, работавших над этим файлом см. в истории файла: https://commons.wikimedia.org/w/index.php?title=File:ReplicationTimingAnim.gif&action=history


В общем случае в статьях энциклопедии Руниверсалис файлы используются в соответствии со статьёй 1274 Гражданского кодекса Российской Федерации.
История файла
Нажмите на дату/время, чтобы увидеть версию файла от того времени.
| Дата/время | Миниатюра | Размеры | Участник | Примечание | |
|---|---|---|---|---|---|
| текущий | 11:00, 2 декабря 2023 | | 960 × 411 (187 КБ) | Я, робот (обсуждение | вклад) | == Описание == {{Изображение | описание = A diagrammatic representation of replication timing in a 70-Mb segment of human chromosome 2. The red horizontal line represents time in S-phase, from early (top) to late (bottom). Grey data points each represent a different DNA sequence position along the length of chromosome 2 as indicated on the x axis, with more positive values on the y-axis indicating earlier replication. A smoothed line (blue) is drawn through the data to visualize the domains... |
Вы не можете перезаписать этот файл.
Использование файла
Следующий файл является дубликатом этого файла (подробности):

- Файл:ReplicationTimingAnim.gif на общем хранилище
Следующая страница использует этот файл:
