

Файл:Comparison gender life expectancy WHO -Asia -ru.svg
Размер этого PNG-превью для исходного SVG-файла: 512 × 407 пкс. Другое разрешение: 2560 × 2035 пкс.


Исходный файл (SVG-файл, номинально 512 × 407 пкс, размер файла: 39 КБ)
Описание
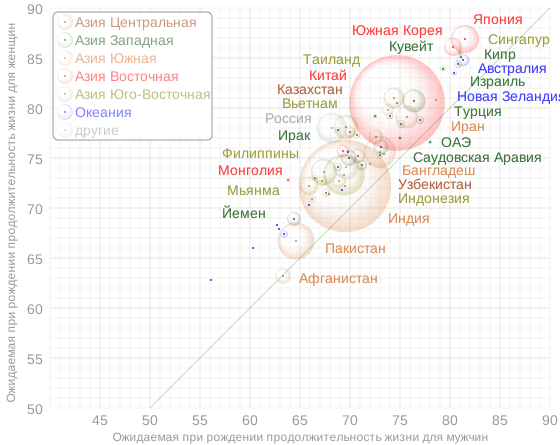
| Описание | This is an interactuve bubble chart of comparison of countries by life expectancy at birth for Asia and Oceania, according to estimation of the World Health Organization for 2019. Open the original svg-file in separate window and hover over a bubble or lettering to highlight related content and to see detail information. The diagonal green line corresponds to equal female and male life expectancy. Square of bubles is proportional to the population of countries, according to estimation of the United Nations for 2019 (link 2). Grouping of countries to subregions is according to the classification of the United Nations. |
|---|---|
| Источник | Own work |
| Время создания | 2022-05-28 |
| Автор или правообладатель | Lady3mlnm — Лицензия: CC0 (Creative Commons Zero, Public Domain Dedication) http://creativecommons.org/publicdomain/zero/1.0/deed.en |
| Другие версии файла | — |
Источник файла — сайт Wikimedia Commons, куда он был загружен под одной из свободных лицензий ( https://commons.wikimedia.org/wiki/File:Comparison_gender_life_expectancy_WHO_-Asia_-ru.svg ). Авторов, работавших над этим файлом см. в истории файла: https://commons.wikimedia.org/w/index.php?title=File:Comparison_gender_life_expectancy_WHO_-Asia_-ru.svg&action=history


В общем случае в статьях энциклопедии Руниверсалис файлы используются в соответствии со статьёй 1274 Гражданского кодекса Российской Федерации.
История файла
Нажмите на дату/время, чтобы увидеть версию файла от того времени.
| Дата/время | Миниатюра | Размеры | Участник | Примечание | |
|---|---|---|---|---|---|
| текущий | 12:45, 3 октября 2023 | | 512 × 407 (39 КБ) | Я, робот (обсуждение | вклад) | == Описание == {{Изображение | описание = This is an interactuve bubble chart of comparison of countries by life expectancy at birth for Asia and Oceania, according to estimation of the [https://apps.who.int/gho/data/node.main.688 World Health Organization for 2019]. Open the original svg-file in separate window and hover over a bubble or lettering to highlight related content and to see detail information. The diagonal green line corresponds to equal female and male life expectancy. Square... |
Вы не можете перезаписать этот файл.
Использование файла
Следующая страница использует этот файл:
