


Файл:3 phase rectification 2-ru.svg
Исходный файл (SVG-файл, номинально 737 × 1052 пкс, размер файла: 41 КБ)
Описание
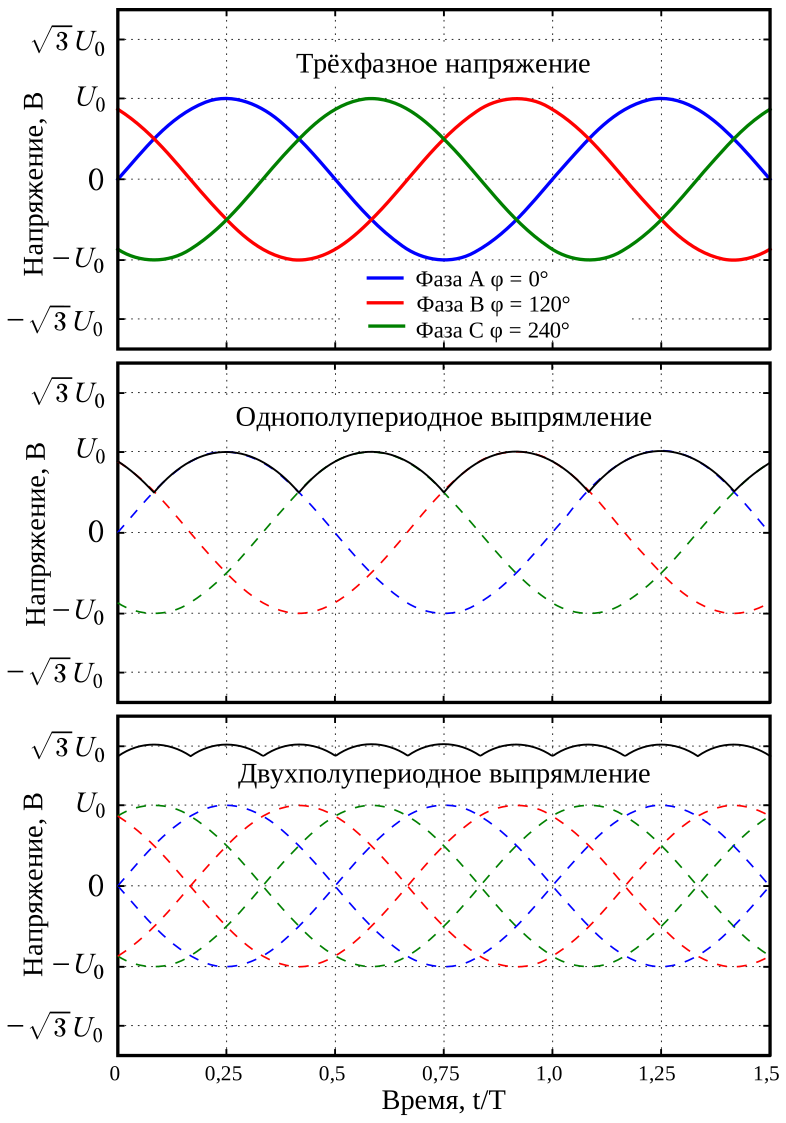
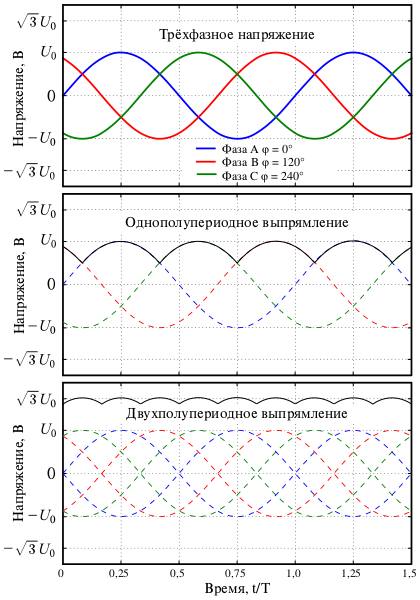
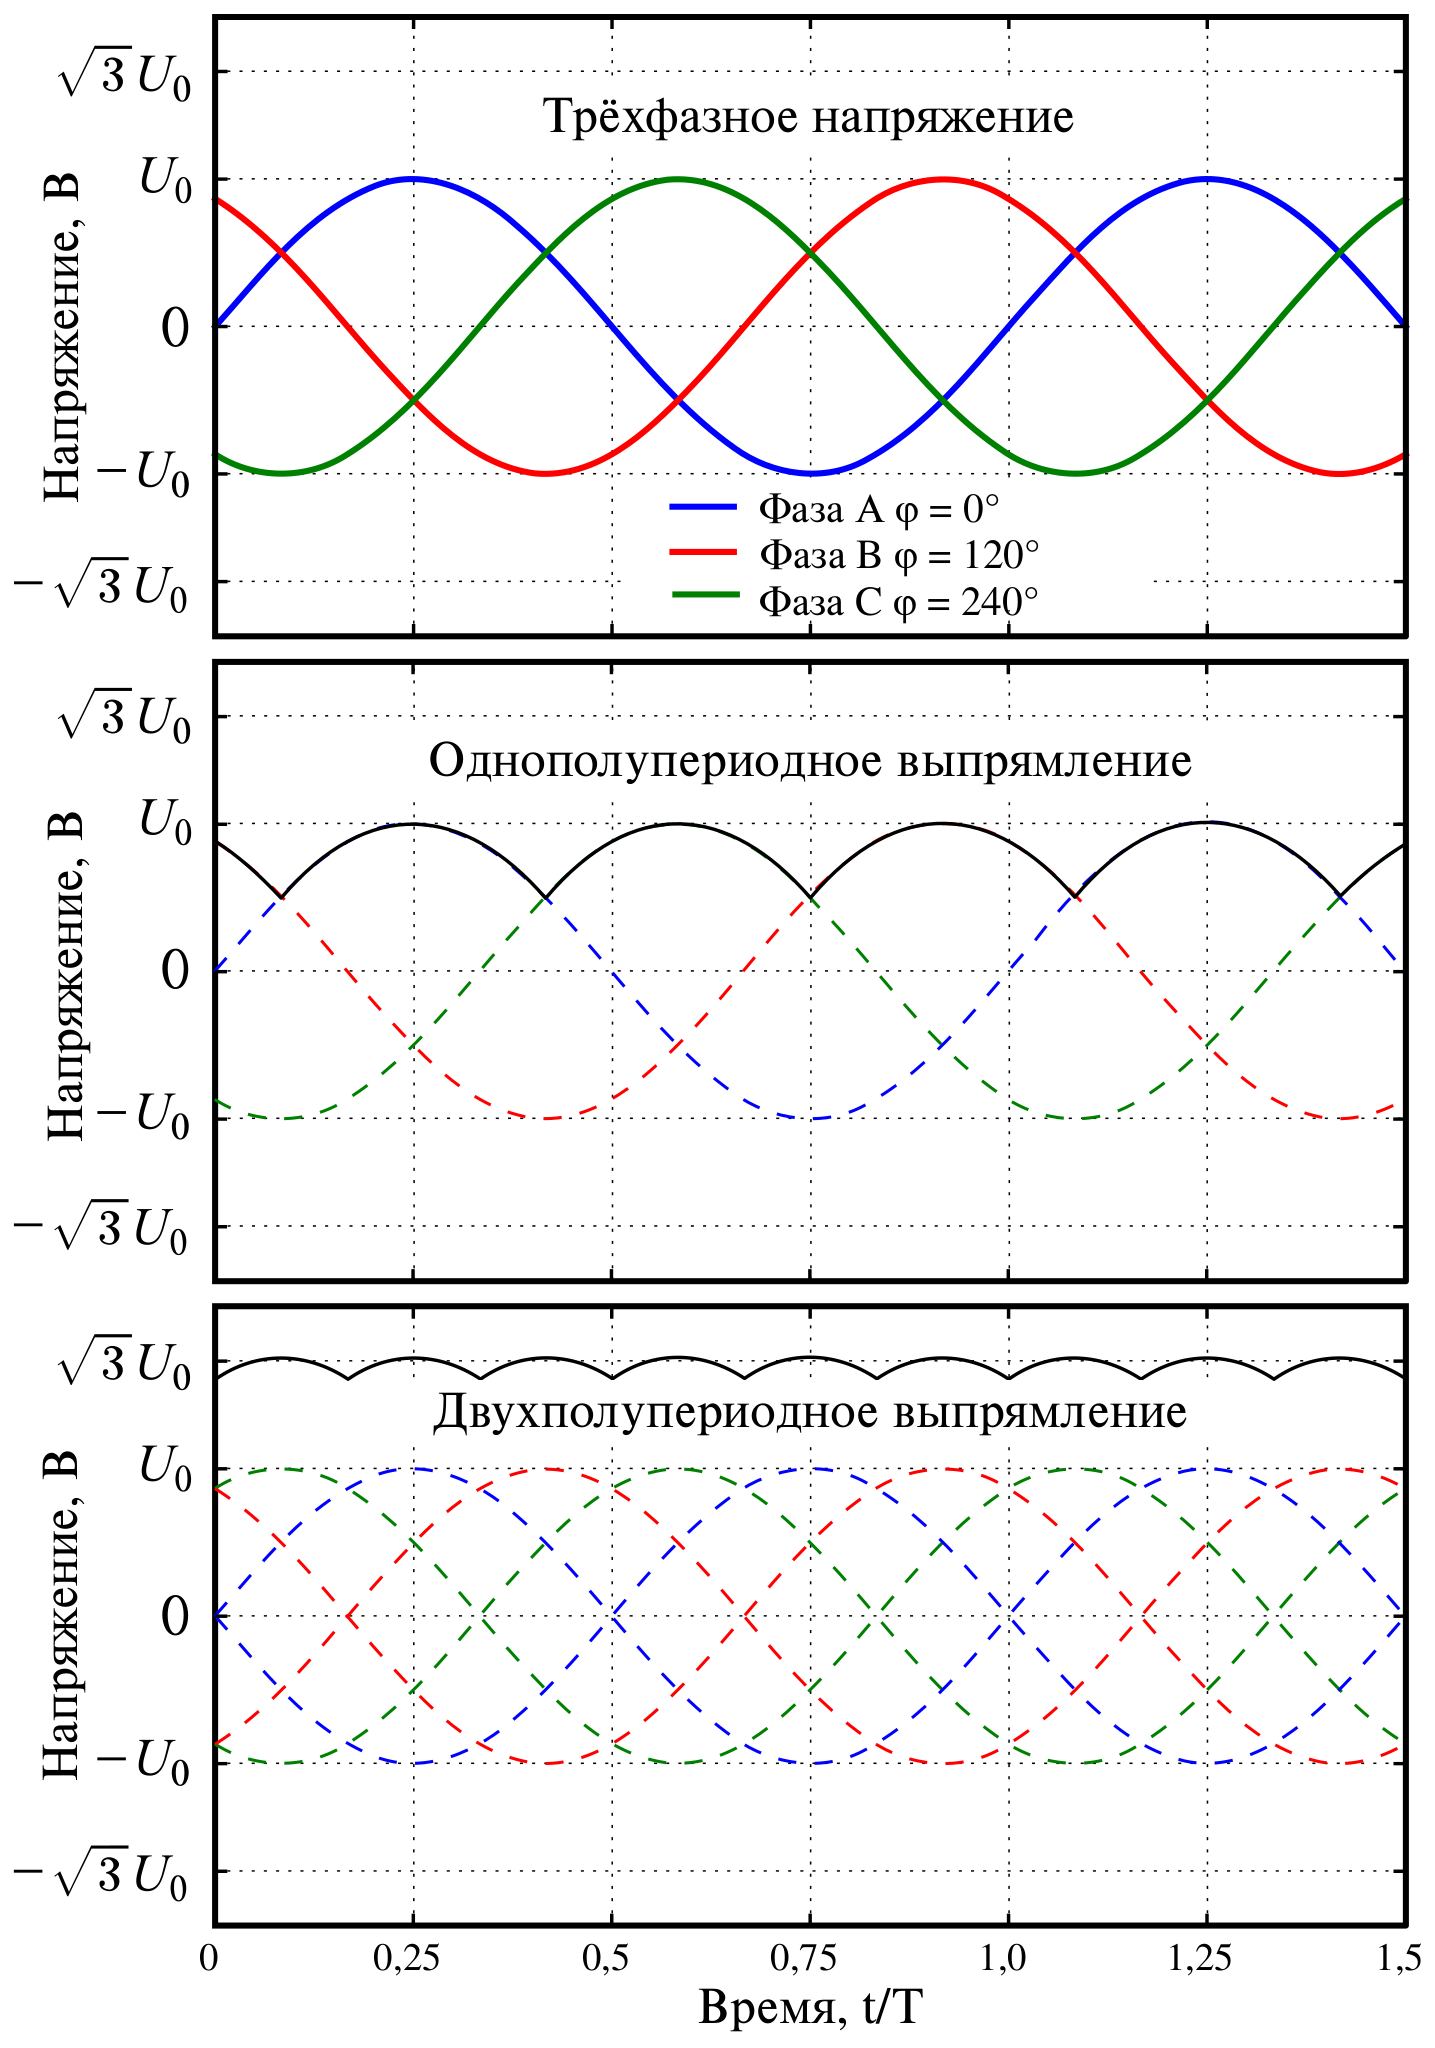
| Описание | Waveforms for a typical 3-phase half-wave and full-wave rectifiers. The top plot shows the individual three phase signals, the middle plot shows the half-wave rectifier output in solid curve and the bottom plot shows the full-wave rectifier output in solid curve. The 'T' in time is the time period of individual signals and <img alt="\scriptstyle V_{{\mathrm {peak}}}" aria-hidden="true" class="mwe-math-fallback-image-inline" src="https://wikimedia.org/api/rest_v1/media/math/render/svg/e16032869f00de5df6c1ac50bc24555df8459075" style="vertical-align: -0.838ex; width:3.829ex; height:2.176ex;"/> is the amplitude of each of the three input signals. |
|---|---|
| Источник | File:3 phase rectification 2.svg by Krishnavedala |
| Время создания | 2020-10-15 |
| Автор или правообладатель | Д.Ильин: translation — Лицензия: CC0 (Creative Commons Zero, Public Domain Dedication) http://creativecommons.org/publicdomain/zero/1.0/deed.en |
| Другие версии файла | — |

Источник файла — сайт Wikimedia Commons, куда он был загружен под одной из свободных лицензий ( https://commons.wikimedia.org/wiki/File:3_phase_rectification_2-ru.svg ). Авторов, работавших над этим файлом см. в истории файла: https://commons.wikimedia.org/w/index.php?title=File:3_phase_rectification_2-ru.svg&action=history


В общем случае в статьях энциклопедии Руниверсалис файлы используются в соответствии со статьёй 1274 Гражданского кодекса Российской Федерации.
История файла
Нажмите на дату/время, чтобы увидеть версию файла от того времени.
| Дата/время | Миниатюра | Размеры | Участник | Примечание | |
|---|---|---|---|---|---|
| текущий | 01:06, 10 сентября 2023 | | 737 × 1052 (41 КБ) | Я, робот (обсуждение | вклад) | == Описание == {{Изображение | описание = Waveforms for a typical 3-phase half-wave and full-wave [https://en.wikipedia.org/wiki/rectifier rectifiers]. The top plot shows the individual three phase signals, the middle plot shows the half-wave rectifier output in solid curve and the bottom plot shows the full-wave rectifier output in solid curve. The 'T' in time is the time period of individual signals and <span class="mwe-math-element"><span class="mwe-math-mathml-inline mwe-math-mathml-a11y... |
Вы не можете перезаписать этот файл.
Использование файла
Следующий файл является дубликатом этого файла (подробности):

- Файл:3 phase rectification 2-ru.svg на общем хранилище
Следующая страница использует этот файл:
