


Файл:3-Learning-curves-for-electricity-prices.png


Исходный файл (2879 × 2478 пкс, размер файла: 110 КБ, MIME-тип: image/png)
Описание
| Описание | Do electricity prices follow learning curves?
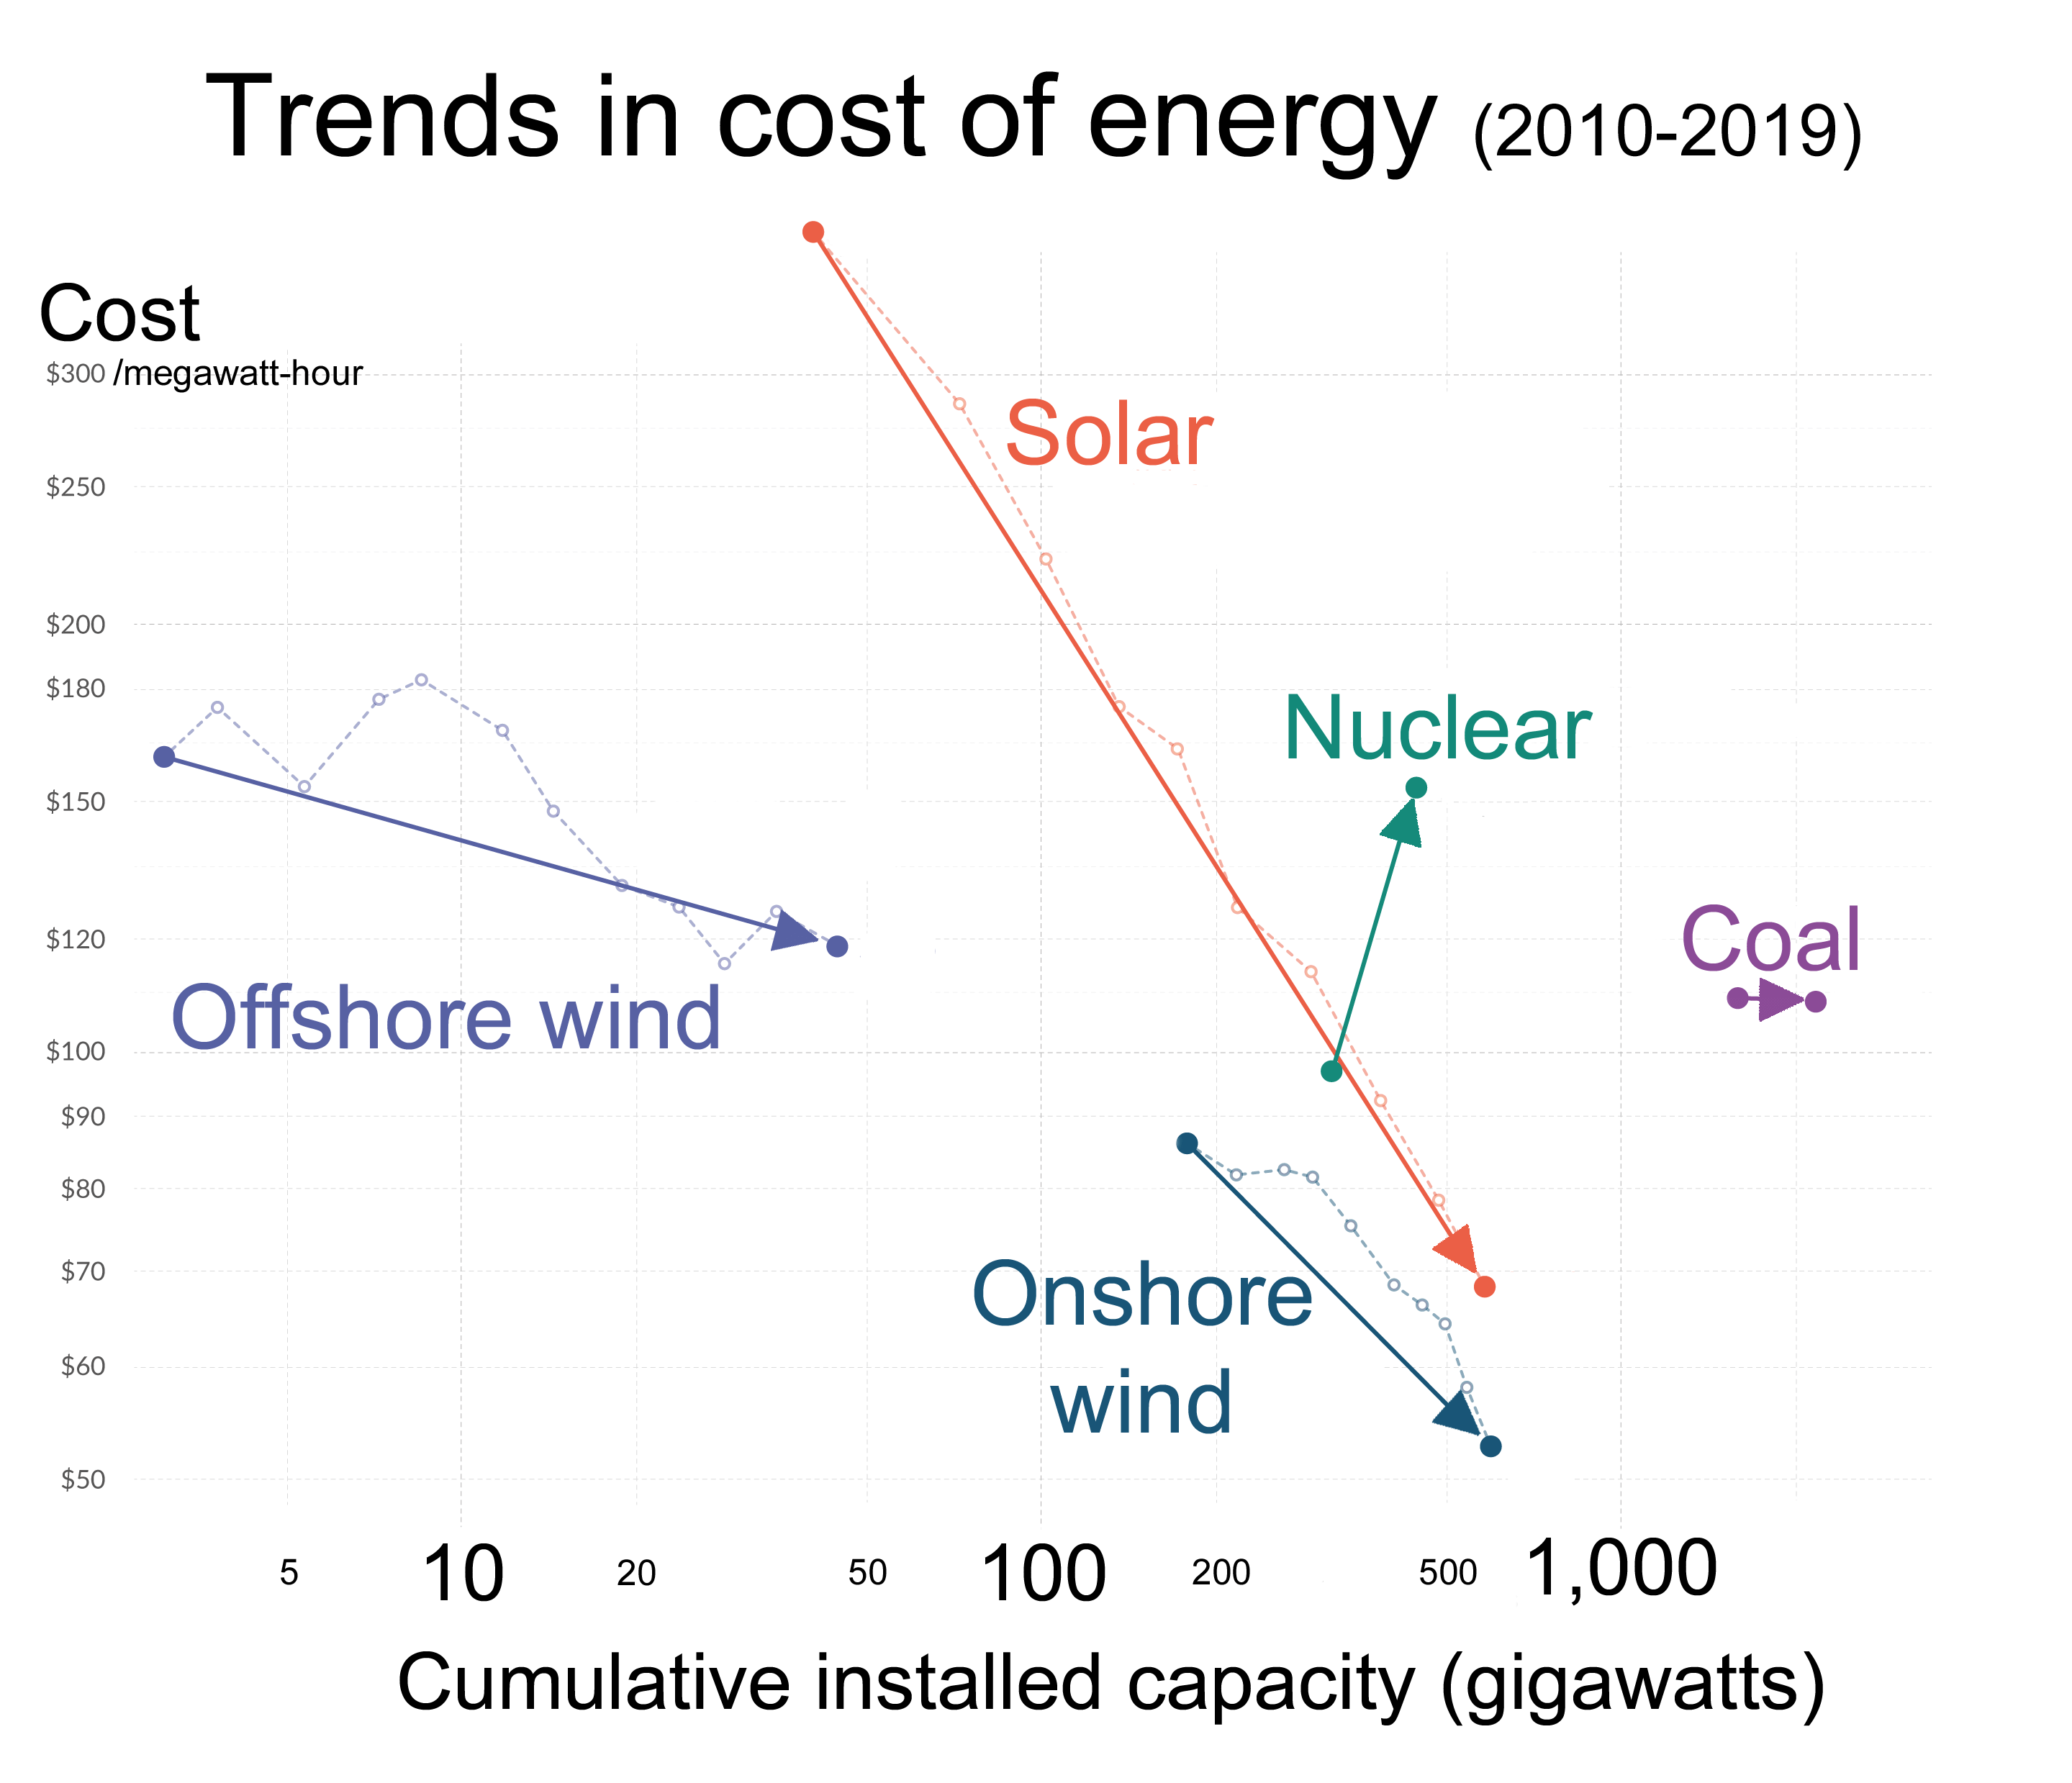
Solar PV modules might very well follow a rapidly declining learning curve, but solar modules themselves are not what we want. We want the electricity that they produce. Does the price of solar electricity follow a learning curve? The visualization shows the relevant data. On the vertical axis you see again the LCOE price for electricity and on the horizontal axis you now find the cumulative installed capacity. As in the solar module chart, both variables are plotted on logarithmic scales so that the line on the charts represents the learning rate for these technologies. In bright orange you see the development for the price of power from solar PV over the last decade. The learning curve relationship that we saw for the price of solar modules also holds for the price of electricity. The learning rate is actually even faster: At each doubling of installed solar capacity the price of solar electricity declined by 36% – compared to 20% for solar modules. Wind power – shown in blue – also follows a learning curve. The onshore wind industry achieved a learning rate of 23%. Every doubling of capacity was associated with a price decline of almost a quarter. Offshore wind had a learning rate of 10% and is still relatively expensive – only 25% cheaper than nuclear and a bit more expensive than coal. But for two reasons experts expect the power from offshore wind to become very cheap in the coming years, larger wind turbine sizes and the fact that the consistent winds out on the sea allows higher load factors. The obvious similarity of onshore and offshore wind also means that learning effects in one industry can be transferred to the other. |
|---|---|
| Источник | |
| Время создания | 2020-12-01 |
| Автор или правообладатель | Our World In Data - Max Roser — Лицензия: CC BY-SA 4.0 (Creative Commons Attribution-Share Alike 4.0) https://creativecommons.org/licenses/by-sa/4.0 |
| Другие версии файла | — |
Источник файла — сайт Wikimedia Commons, куда он был загружен под одной из свободных лицензий ( https://commons.wikimedia.org/wiki/File:3-Learning-curves-for-electricity-prices.png ). Авторов, работавших над этим файлом см. в истории файла: https://commons.wikimedia.org/w/index.php?title=File:3-Learning-curves-for-electricity-prices.png&action=history


В общем случае в статьях энциклопедии Руниверсалис файлы используются в соответствии со статьёй 1274 Гражданского кодекса Российской Федерации.
История файла
Нажмите на дату/время, чтобы увидеть версию файла от того времени.
| Дата/время | Миниатюра | Размеры | Участник | Примечание | |
|---|---|---|---|---|---|
| текущий | 17:50, 9 сентября 2023 | | 2879 × 2478 (110 КБ) | Я, робот (обсуждение | вклад) | == Описание == {{Изображение | описание = Do electricity prices follow learning curves? <p>Solar PV modules might very well follow a rapidly declining learning curve, but solar modules themselves are not what we want. We want the electricity that they produce. Does the price of solar electricity follow a learning curve? </p><p>The visualization shows the relevant data. On the vertical axis you see again the LCOE price for electricity and on the horizontal axis you now find the cumulative ins... |
Вы не можете перезаписать этот файл.
Использование файла
Следующий файл является дубликатом этого файла (подробности):

- Файл:3-Learning-curves-for-electricity-prices.png на общем хранилище
Следующая страница использует этот файл:
